4. Linear Distortion Measurements
4.1. Amplitude Frequency Response
Definitions
and test conditions:
Measurement of the
amplitude frequency response is the classic measurement task. Since this type
of measurement is much more frequent than phase frequency response measurement,
it is often described simply as the frequency response.
The frequency response of amplifiers is measured in accordance with DIN IEC
268-3 at 10 dB below the full-scale amplitude by sweeping an input signal of
constant level over the frequency range. The output level is plotted against
the frequency.
With digital components, the frequency response is measured in accordance with
AES 17 at -20 dBFS.
Graphic
display:
In accordance with IEC 268-1, the frequency response is represented by
displaying the rms output level in dB along the frequency axis using a
logarithmic scale. The x- and y-axis scalings should be chosen such that a
frequency decade corresponds in size to a level difference of 50 dB (10 dB and
25 dB are also permissible). As with modern audio equipment, level differences
are often very small, the scalings stated above may sometimes not be
appropriate for revealing the fine structure of the frequency response. In the setups
described, therefore, the y-axis has been scaled for ±10 dB, which more closely reflects practical requirements.
If the set y-axis scaling is inappropriate or if results are outside the
displayed range, it is best to switch from MANUAL to AUTO ONCE in
the SCALING line in the DISPLAY panel. As a result, the graphic display
on Audio Analyzers UPD and UPL will be scaled such that, after a single sweep,
all results are represented on the display.
IEC 268-1 defines a reference frequency of 1 kHz for the level values. This
applies however only to analog systems. In accordance with AES 17, a reference
frequency of 997 Hz is to be used for digital as well as analog and digital
systems.
Notes
on measurements:
The amplitude frequency response can be measured in different ways with
Audio Analyzers UPD and UPL. The differences are described in detail in the
following.
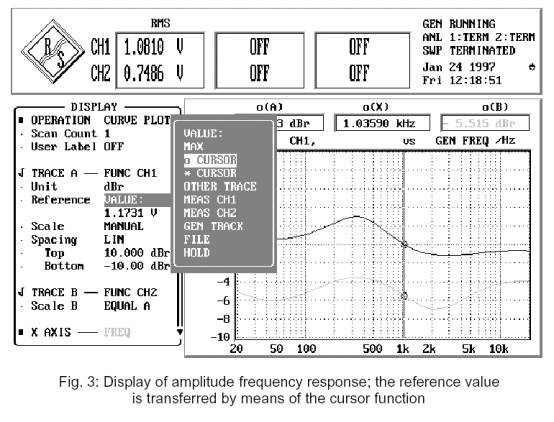
In both cases, levels are represented in dBr. The user must, however, refer
levels to 1 kHz or 997 Hz. This is easiest done by placing a cursor on the
reference frequency (select cursor in GRAPH panel) and by transferring the
cursor value into the Reference line in the option window of the DISPLAY
panel (see Fig. 3). Depending on the test points selected, it may not be
possible to place the cursor precisely on the reference frequency. In most
cases it will however suffice to place it on an adjacent point. If there are large
variations of the frequency response in the vicinity of the reference
frequency, interpolation has to be performed or the point determined exactly by
way of measurement.
4.1.1. Sweep
Measurements Using Signals from UPD/UPL Generator
Setups:
o
LEVS_AA.SAC
o
LEVS_AD.SAC
o
LEVS_DA.SAC
o
LEVS_DD.SAC
This measurement is the
standard measurement, as it were. The generator supplies a sinewave signal which
is swept logarithmically at a constant level over the frequency range 20 Hz to
20 kHz. The rms output level of the DUT is measured and displayed graphically.
The
above setups provide for a sweep with 50 frequency points. The set measurement
speed is GENTRACK, ie the analyzer adjusts the measurement time for each
point to the cycle time of the generator signal, which results in very high
measurement speeds.
4.1.2. Sweep
Measurements Using Signals from External Source
Setups:
o
LEVSE_AA.SAC
o
LEVSE_DD.SAC
Measuring the amplitude frequency
response of a two-terminal DUT, eg a CD player, is not possible by means of the
UPD/UPL generator. Such measurements are performed using a stored test sequence
(eg from a test CD). To determine the test points, the analyzer measures not
only the level but also the corresponding frequency of the test signal. With
UPD/UPL, this is done by means of the external sweep function, which is
selected under START CONDITION in the ANALYZER panel.
In the setup described here, the parameters of the external sweep were selected
for use with the UPA-CD test CD from Rohde & Schwarz. Measurement values
are collected on a specific frequency change detected in input channel 1. The FRQ
FST CH1 function used here makes for very fast frequency measurements but
requires clean signals. When making measurements on signal sources with high
noise content (eg cassette recorders), the slower FRQ CH1 measurement
function must be used instead.
In this setup, the frequency response between 20 Hz and 20 kHz is determined
with the frequency points spaced 5%, ie after a frequency change of 5% referred
to the input signal a new level measurement is started.
The first test point is recorded when UPD/UPL for the first time measures a
frequency higher than the set START frequency; the measurement sequence
is terminated when the STOP frequency is attained. To ensure that the
sweep function from the test CD is recorded right from the start, the sweep
function must be activated on the analyzer by pressing the START key before the
test sequence for the DUT is started.
The setups provide for frequency response display only for channel 1 since the
test CD supplies a singlechannel signal. By activating channel 2 in the
ANALYZER panel and TRACE B in the DISPLAY panel, the second channel too
will be displayed.
For standardized measurements of the frequency response of CD players, it is
necessary, as an initial step, to measure for both channels the rms output
voltage of the CD player while playing the signal with the recorded reference
level (at 1 kHz, track 1 of test CD) and store the results as reference values
for both channels (DISPLAY panel, Reference line). To this effect, the
scaling for channel 2 must be set to NOT EQUAL A and the reference value
for Trace B entered separately.
Please note that the frequency response for each channel is thus referred to
the level at 1 kHz. Any level differences between the two channels will not be
recognized from the frequency response traces.
For detailed information on this type of measurement refer to Application Note
1GA12_1E, "External Sweep and Adaptive Measurement of DUTs with Extreme
Transients Using Settling Function of UPD" available from your Rohde &
Schwarz representative.
4.1.3. Fast Frequency Response Measurements Using FFT
Setups:
o
FFLEV_AA.SAC
o
FFLEV_DD.SAC
Although UPD and UPL provide
extremely fast level measurements, swept frequency response measurements do not
always satisfy speed requirements, for example in alignments or production. To avoid
measurement errors caused by the windowing of the FFT, a rectangular window is
used. This however requires the use of a special test signal. Audio Analyzers
UPD and UPL generate a pseudo noise signal consisting of many discrete
frequency lines, each line being an integer multiple of the analysis time window
and thus being precisely matched to the frequency lines of the FFT analysis.
Moreover, the test signal used should have a small crest factor to avoid
overdriving of the DUT input by high peak voltage levels, which would be the
case with white noise.
In this setup, FFT analysis with 2k points has been selected; this results in
frequency response measurement with over 960 points with constant frequency
spacing.
The generator signal is produced by means of the RANDOM function. This
yields a multi-frequency signal whose frequencies are matched to the FFT lines
of the analyzer (setting: ANL TRACK) and whose phases are optimized
relative to one another for the smallest possible crest factor.
For this calculation, the generator requires a few seconds; the process is
indicated in the status display in the upper right-hand corner of the screen.
The measurement itself is performed at the speed of a single FFT. When the
frequency response of the DUT is varied, the variation can be observed on the
screen quasi in realtime since all test points are determined simultaneously.
The setup can be adapted to a finer or coarser resolution of the frequency
points by selecting a different FFT size. However, the higher the number of
frequency lines selected, the longer computation time of the generator prior to
the start of the first measurement.
The voltage values of the test points shown in the graphic display are far
below the rms values of the test signal. The latter, however, are the rms
values of the bins of the FFT analysis, and when adding the squares of the
discrete level values the rms value of the total signal is obtained. In this,
FFT measurements differ from swept measurements, where the DUT is driven at one
frequency only, whereas in measurements using a pseudo noise signal the total
energy of the signal is distributed (broadband).
For this type of measurement, too, an Application Note is available: "Fast
Frequency Response Measurements with Audio Analyzer UPD", 1GA04_1E.
4.1.4. Frequency
Response Measurement at Different Levels
Setups:
o
MLEVS_AA.SAC
o
MLEVS_DD.SAC
In testing tape recorders with
noise suppression, the frequency response must be determined at different levels
since the Dolby method, for example, operates level-dependent. But in other
cases too the variation of a parameter as a function of frequency and level is
of interest. Fig. 4 shows as an example the leveldependent frequency response
of a filter with limiter.

As mentioned under 4.1.1, the generator signal is swept over a frequency
range from 20 Hz to 20 kHz. Moreover, a
second sweep parameter can be activated in the GENERATOR panel; for this setup,
the parameter Z Axis VOLT has been selected. The start level is 1 V, the
stop level 0.1 V and the stepwidth -5 dB. The first frequency sweep is
performed at a level of 1 V, in each following sweep the level is reduced by 5
dB.
As a result, five traces are obtained. Single-channel representation has been
selected for this setup in the interest of a clear-cut display. The second
channel can be displayed by activating Trace B in the DISPLAY panel.
In this way, any number of traces can be displayed. For each channel, the last
17 traces can be stored. The measured
data of the last 17 traces can further be evaluated using the cursors;
switchover between traces can be made by means of the Page up / Page down keys.
4.1.5. Level Difference
between Two Stereo Channels
Setups:
o
LEVDS_AA.SAC
o
LEVDS_AD.SAC
o
LEVDS_DA.SAC
o
LEVDS_DD.SAC
With stereo equipment it is sometimes of interest to display channel
unbalance as a function of frequency.
The measurement procedure is the same as for the dual-channel frequency
response measurement described under 4.1.1, "Sweep Measurements".
However, Trace A shows the frequency response for channel 1, whereas Trace
B shows the level difference for channel 2 referred to channel 1. This is possible
by setting the reference value for channel 2 not to a fixed value but taking
the current measured value of channel 1 as a reference (setting: Reference
MEAS CH1).
It is also possible to display the differential trace alone. To this end,
simply switch off Trace A.
As another application, this setup can be used for determining the difference
between the current and the previous frequency response of a DUT. For this, the
stored results of previous measurements are required; the stored data will be
taken as a reference for the current measurement when the corresponding file is
called under Reference.
4.2. Phase and Group-Delay Measurements
Definitions
and test conditions:
Measurement of the phase frequency response of amplifiers is also
defined by DIN IEC 238-3.
Same as amplitude frequency response, phase frequency response is
measured under standard test conditions. The input signal is swept over the
frequency range at a constant level; results are graphically displayed versus
frequency.
In the standard, a differentiation is made between two measurements:
o
Determination of the phase frequency response, the phase
difference between the input and the output of a DUT is measured and displayed
versus frequency.
o
Determination of the phase difference, the phase difference
between the two stereo output channels of a DUT is measured and displayed
graphically.
4.2.1. Measurement of
Phase Frequency Response
Setup:
o
PHAS_AA.SAC
With this setup, a logarithmic
sweep with 50 frequency points is performed from 20 Hz to 20 kHz. UPD/UPL always measures the phase difference
between its two input channels. To avoid any recabling of the DUT, channel 2 of
the analyzer has for this measurement been internally connected to the channel
1 output of the generator. As a result, the phase difference between the input
and the output of the DUT is measured in channel 1 of the DUT. Fig. 5 shows the
setting for this setup.

To measure the phase frequency response of the two stereo channels of a
DUT, proceed as follows: after measuring channel 1, switch over to HOLD under
TRACE A in the DISPLAY panel. Activate the display of phase frequency response results for channel 2 under TRACE
B. Then reconnect the analyzer inputs: connect Ch1 Input to the
internal generator and Ch2 Input to the DUT. When the sweep is
restarted, the phase frequency response for the second channel will be
displayed.
4.2.2. Measurement of
Phase Difference between Two Stereo Channels
Setups:
o
PHADS_AA.SAC
o
PHADS_DD.SAC
The procedure is similar to that
described under 4.2.1 except that in this case both output channels of the DUT
are connected to the inputs of UPD/UPL. The phase difference between the two
stereo channels is displayed with channel 1 taken as a reference.
4.2.3. Measurement of
Group Delay Versus Frequency
Setup:
o
GRPS_AA.SAC
For measuring the group delay, the information given under 4.2.1,
"Measurement of Phase Frequency Response", applies analogously.
Instead of phase measurement, the FREQ&GRPDEL setting is selected in
the FREQ/PHASE line of the ANALYZER panel.
4.3. Combined Measurements
In the following setups, the
results of amplitude and phase frequency response measurements are combined in
one graphic display. For measurement procedures see relevant sections above.
4.3.1. Amplitude and Phase Frequency Response in One Display
Setup:
o
PHLVS_AA.SAC
Combined display of amplitude and phase frequency response for channel
1.
4.3.2. Phase Difference and Level Difference between Two Stereo Channels in One Display
Setups:
o
PDLDS_AA.SAC
o
PDLDS_DD.SAC
Combined display of phase and level difference between two stereo
channels referred to channel 1.
4.3.3. Group Delay and Amplitude Frequency Response in One Display
Setup:
o
GRLVS_AA.SAC
Combined display of group delay and amplitude frequency response for
channel 1.